What is MS Excel?
Microsoft Excel is a powerful spreadsheet program developed by Microsoft as part of the Microsoft Office suite. It is widely used for various purposes, including data analysis, financial modeling, business planning, and more. While Excel is a powerful tool, it’s important to note that for very large datasets or complex analyses, specialized software or databases may be more suitable.
Features

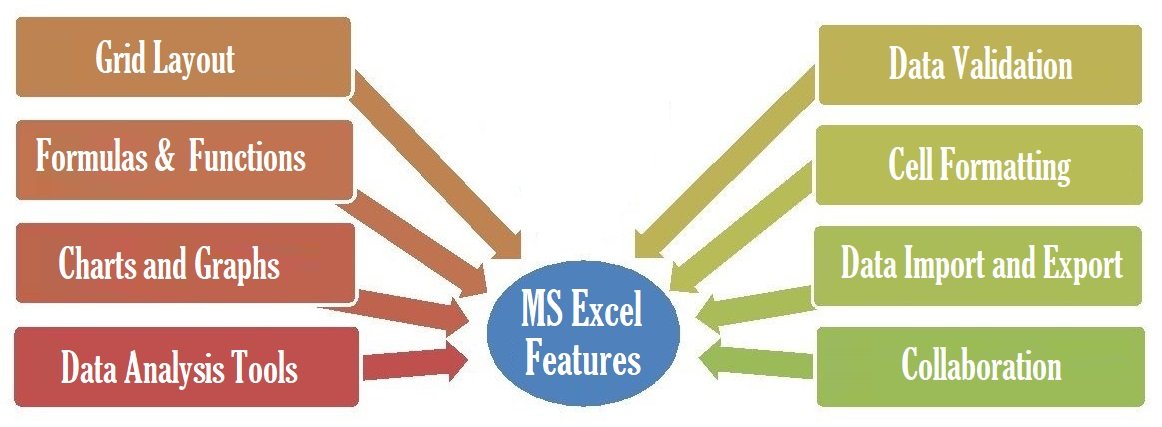
Grid Layout: Excel uses a grid system where data is organized into rows and columns, forming cells. This structure makes it easy to input and manipulate data.
Formulas and Functions: Excel allows users to perform calculations using formulas and functions. Formulas can be created to perform mathematical operations, and functions provide predefined formulas for common calculations.
Charts and Graphs: Excel offers a variety of chart types to visually represent data. Users can create bar charts, line graphs, pie charts, and more to make data analysis more accessible and understandable.
Data Analysis Tools: Excel provides various tools for data analysis, including sorting, filtering, pivot tables, and conditional formatting. These features make it easier to analyze and interpret large sets of data.
Data Validation: Users can set rules and criteria to validate data entered into cells. This helps maintain data accuracy and consistency.
Cell Formatting: Excel allows users to format cells in terms of font, color, borders, and more. This helps in improving the presentation of data and making it more visually appealing.
Data Import and Export: Excel supports the import and export of data in various formats, making it easy to integrate with other software and systems.
Collaboration: Excel offers collaboration features, allowing multiple users to work on a spreadsheet simultaneously. Users can track changes, leave comments, and share workbooks through cloud services like OneDrive or SharePoint.
Advantages

Versatility: Excel is a versatile tool that can be used for a wide range of tasks, from simple data entry to complex financial modeling and analysis.
Accessibility: Excel is widely used in business and academia, making it a standard tool that many people are familiar with. This increases accessibility and collaboration opportunities.
Time Efficiency: The use of formulas and functions significantly reduces the time required for calculations and analysis. Excel automates repetitive tasks, saving time and increasing efficiency.
Data Visualization: The ability to create charts and graphs makes it easier to visualize trends and patterns in data, helping users make informed decisions.
Scalability: Excel can handle small to large datasets, and its scalability makes it suitable for both personal and professional use.
Integration: Excel integrates well with other Microsoft Office applications and can also import and export data from/to various file formats, making it compatible with a wide range of software.
Learning Resources: There are numerous tutorials, guides, and online resources available for learning Excel, making it accessible to users with varying levels of expertise.
also see:
![]()
| HTML | DATA STRUCTURE |
| DBMS | REASONING |
| C PROGRAM | APTITUDE |
| E-LEARNING |


